

The span store
Every span goes into one Quickwit index, the span store, named by theTRACE_INDEX_ID environment variable. It defaults to otel-traces-v0_9.
Spans always land there, whatever index the ingest API key is scoped to. The key’s index applies to its log ingestion only.
The span store is not a log index, so you can’t open it in the log explorer.
How you reach a trace
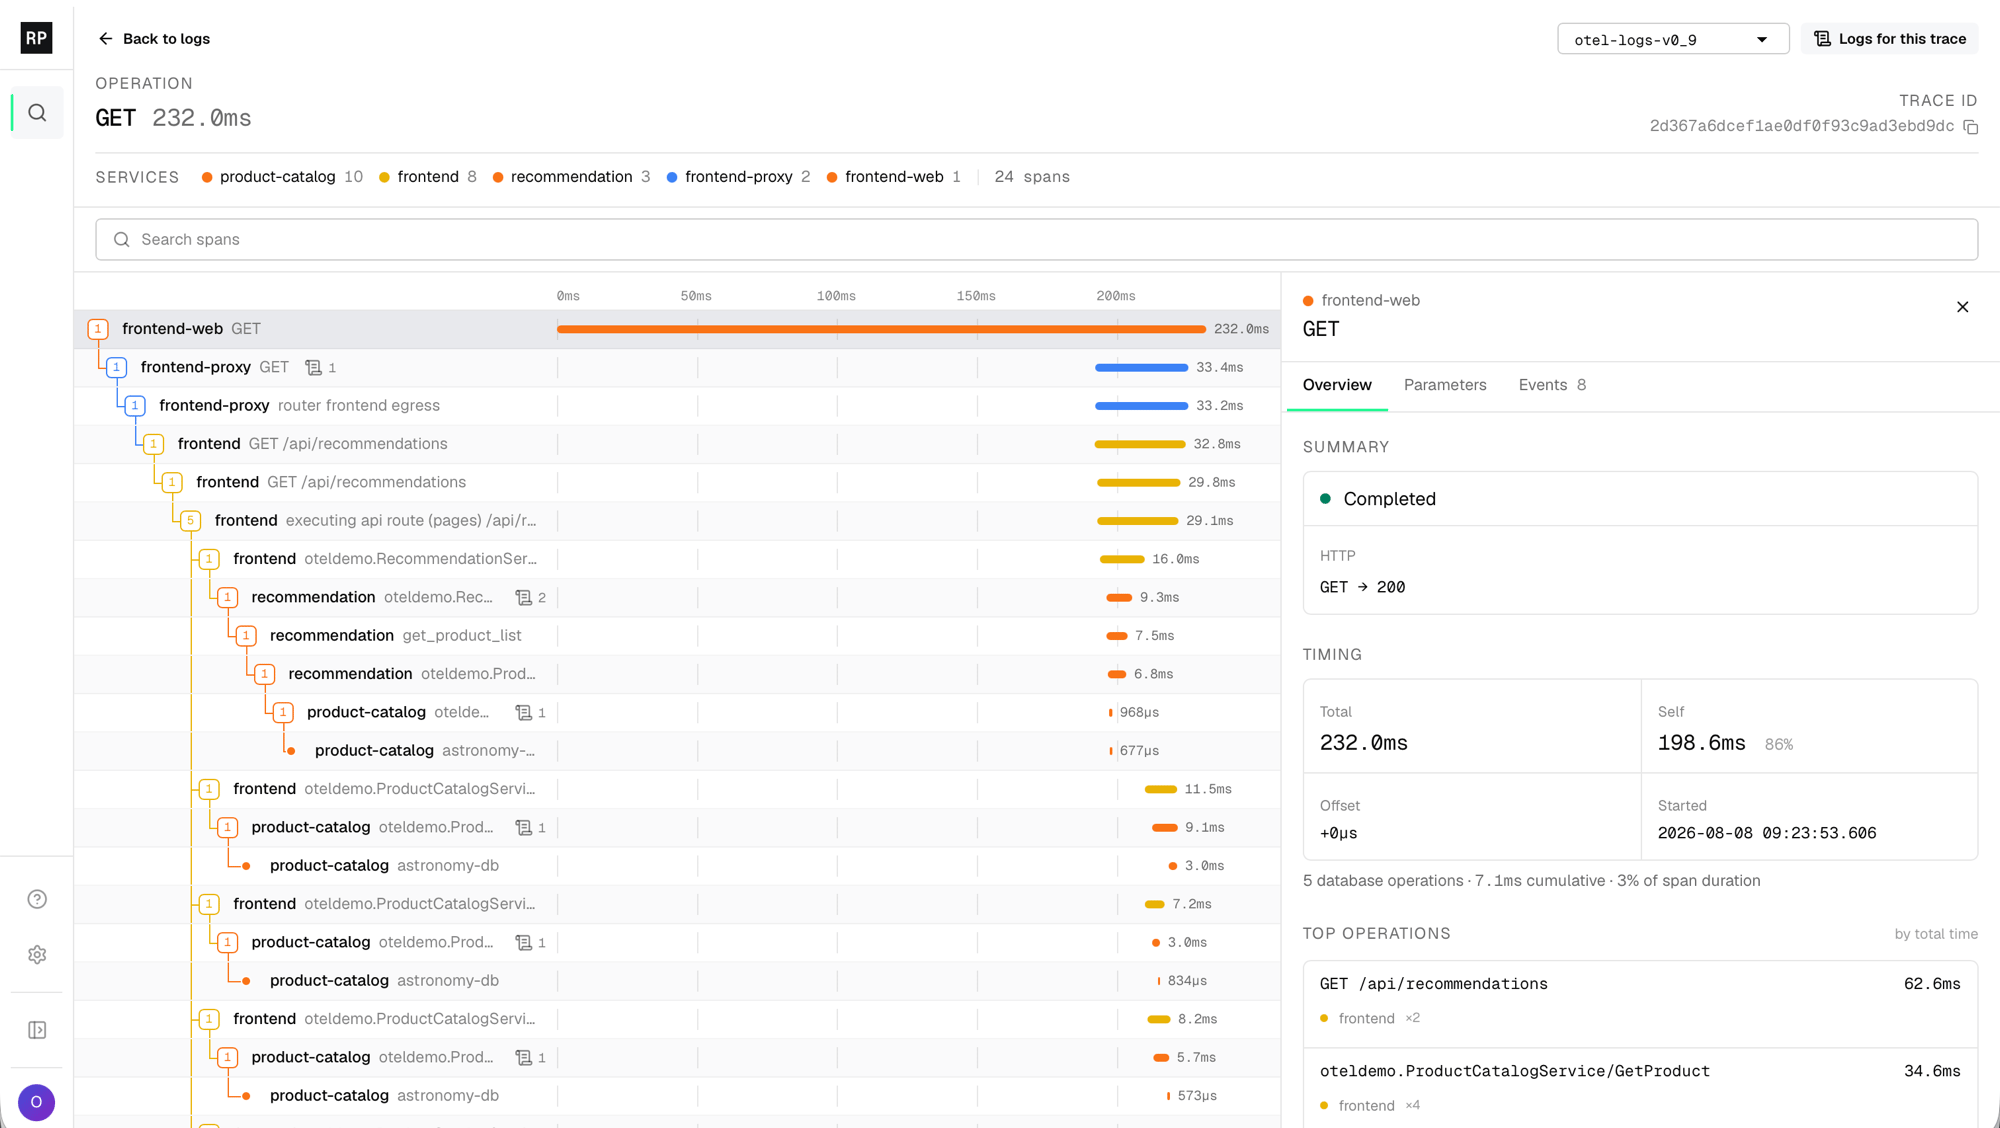
Open a trace from the trace explorer, a log’s Trace tab, a failing span in service health, a pasted trace ID, or its URL. See Read a trace.Trace retention and time ranges
A trace opens whatever time range you have applied, for as long as its spans are retained. The trace explorer and service health search only the time range you pick.Limits
Trace, span, and service health reads are recorded in the search audit and count against the read rate limit, like log searches. See Rate limiting.
Next steps
Send traces
Point an OpenTelemetry SDK or Collector at the trace endpoint.
Trace explorer
Filter spans across every trace and open the one you need.
Read a trace
The waterfall, span search, span details, and correlating spans with logs.
Service health
Request rate, error rate, latency, downstream calls, and failing spans, from the same spans.